
Your Event Report: Check Event Performance by Date, Channels, and Teams
Need to understand what’s actually driving your event sales? The Event Report makes it quicker to filter performance, spot your best offers and channels, and find specific customers fast.
Agenda
Performance: understand your data views
2.1 Line chart: bookings, revenue, or views over time
2.2 Booking mix: which offers drive your sales
Bookings: find customers fast (and filter smarter)
3.1 What you can see in the bookings list
3.2 Filters
1.Filter all your event data
The Event Report lets you filter the whole report so all charts and tables update together.
Log in to XCEED Pro.
Open the event you want to analyse.
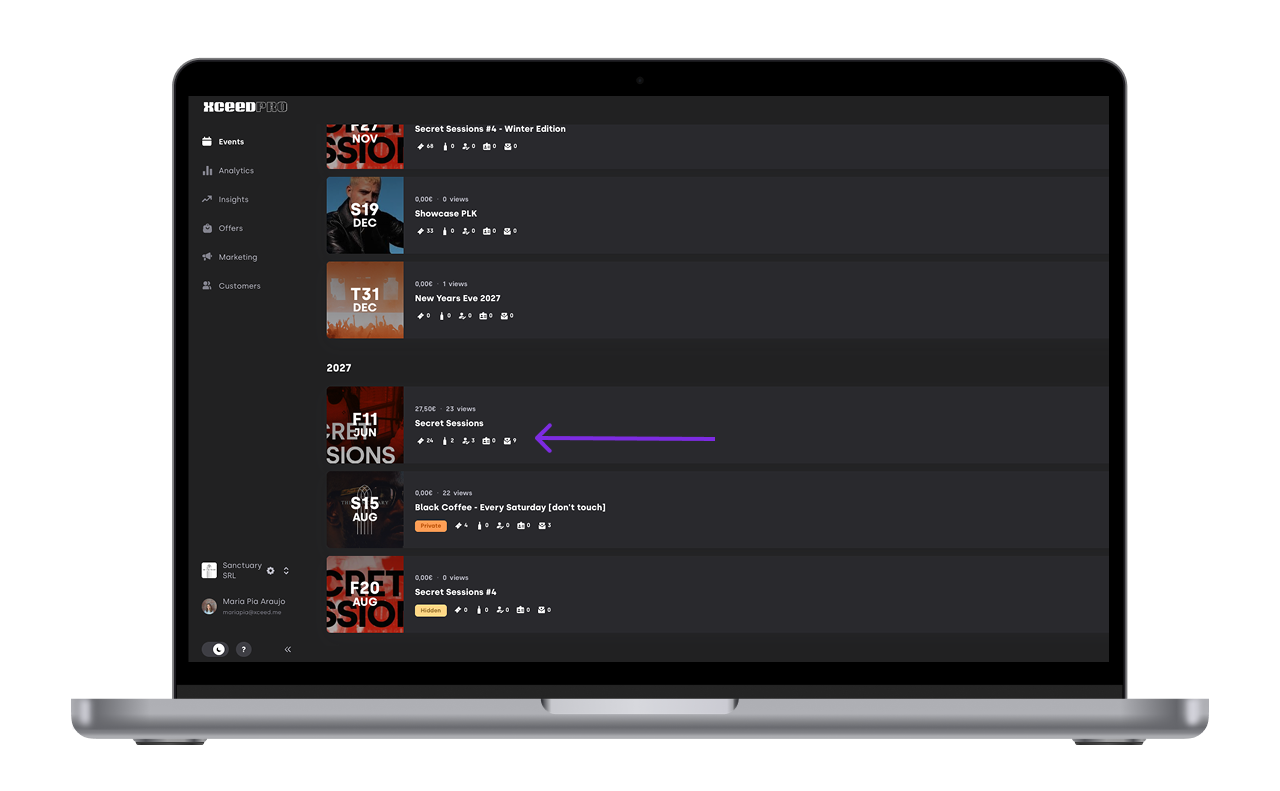
Go to the Event Report section inside the event.


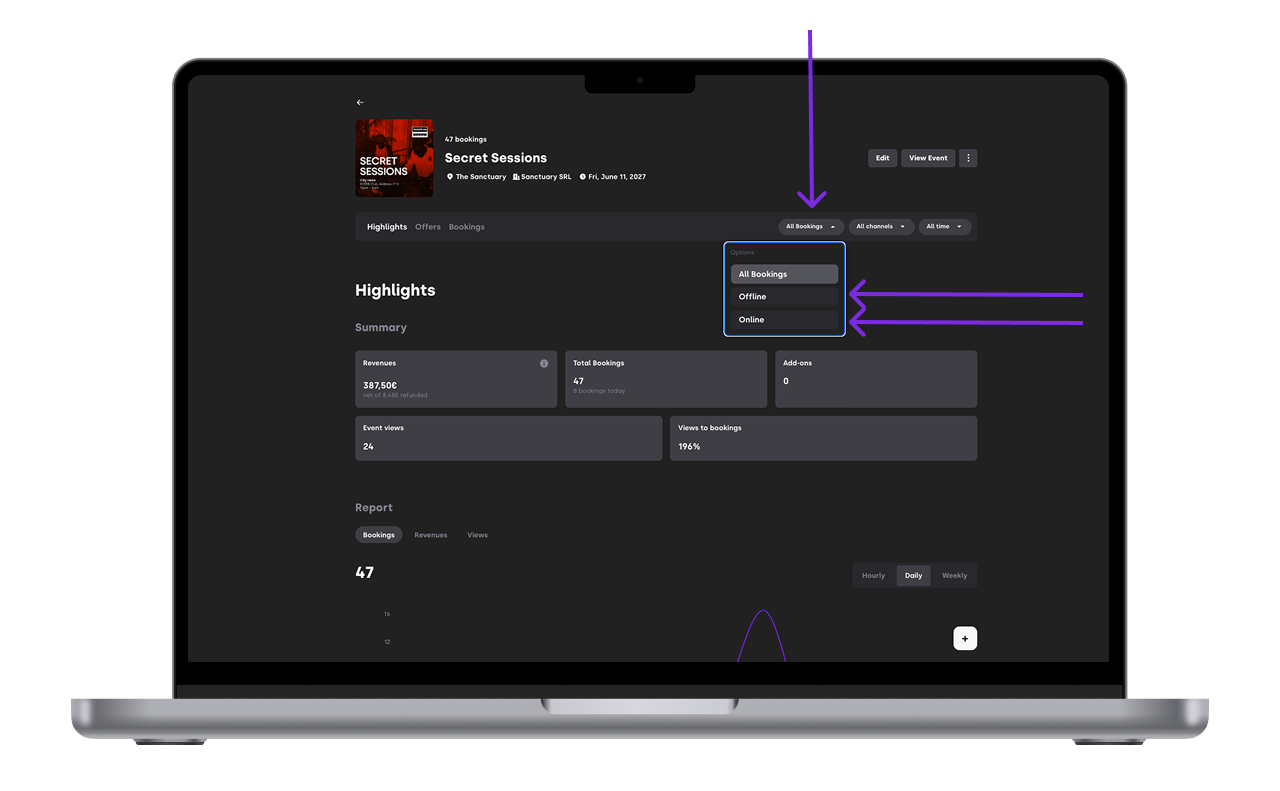
1.1 Filter by Online / Offline sales
Use this to switch between:
Online sales
Offline sales

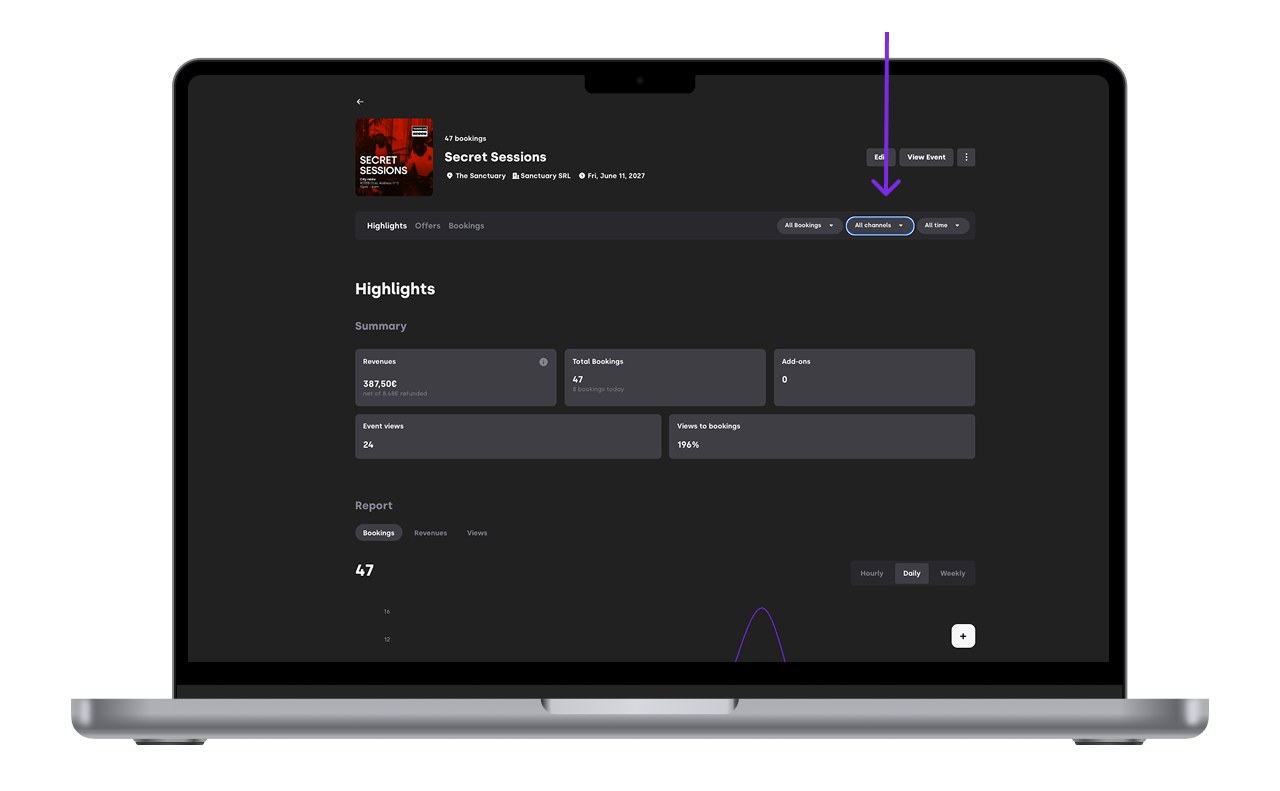
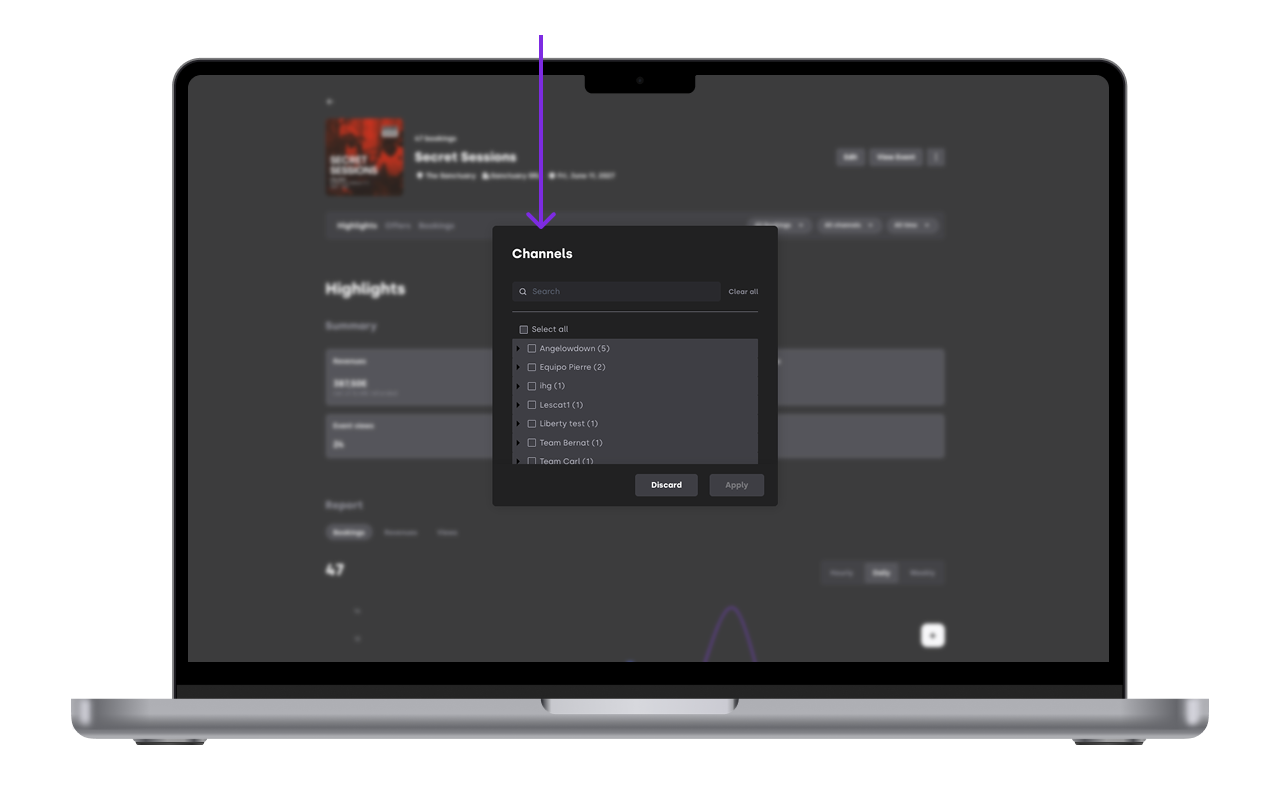
1.2 Filter by channel
Use this to analyse performance by:
A specific promoter/channel
A team/channel group (depending on your setup)


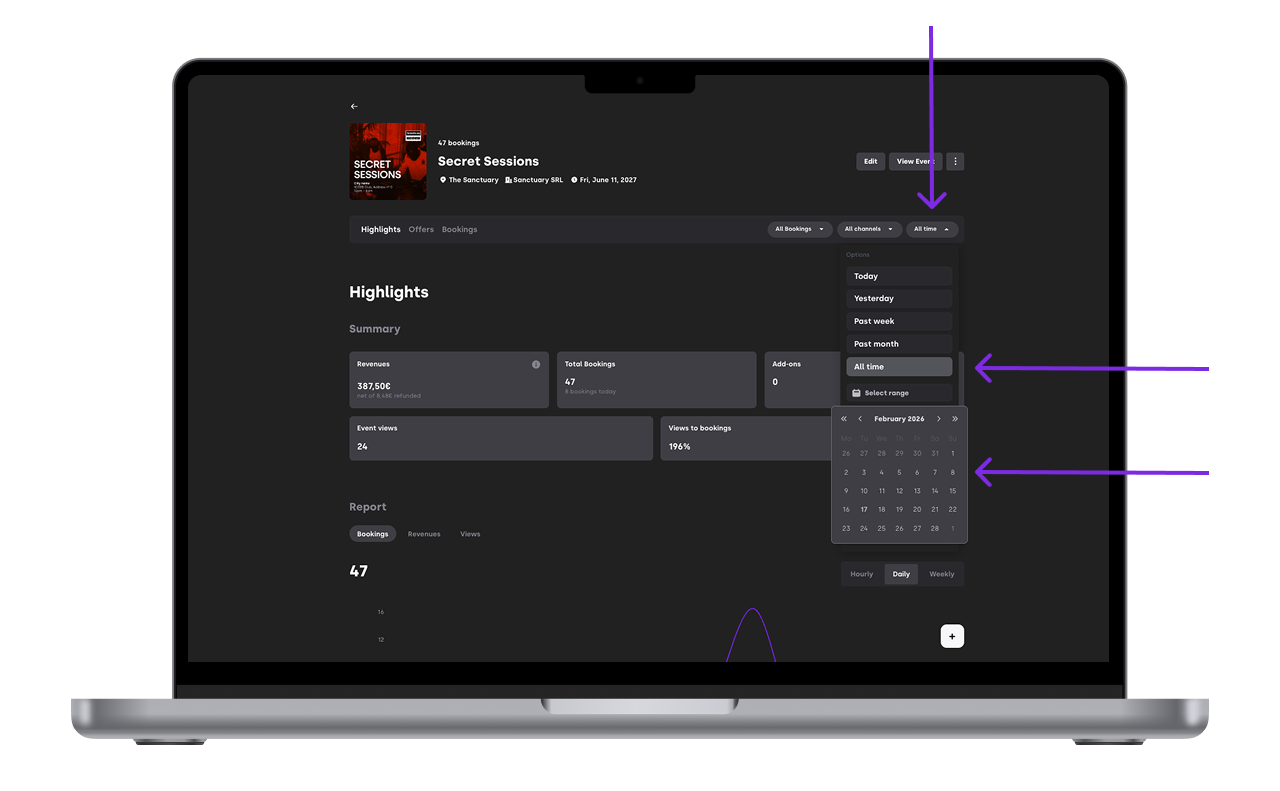
1.3 Filter by date range
Use this to focus on:
A specific promo window
The full on-sale period
A last-minute sales push

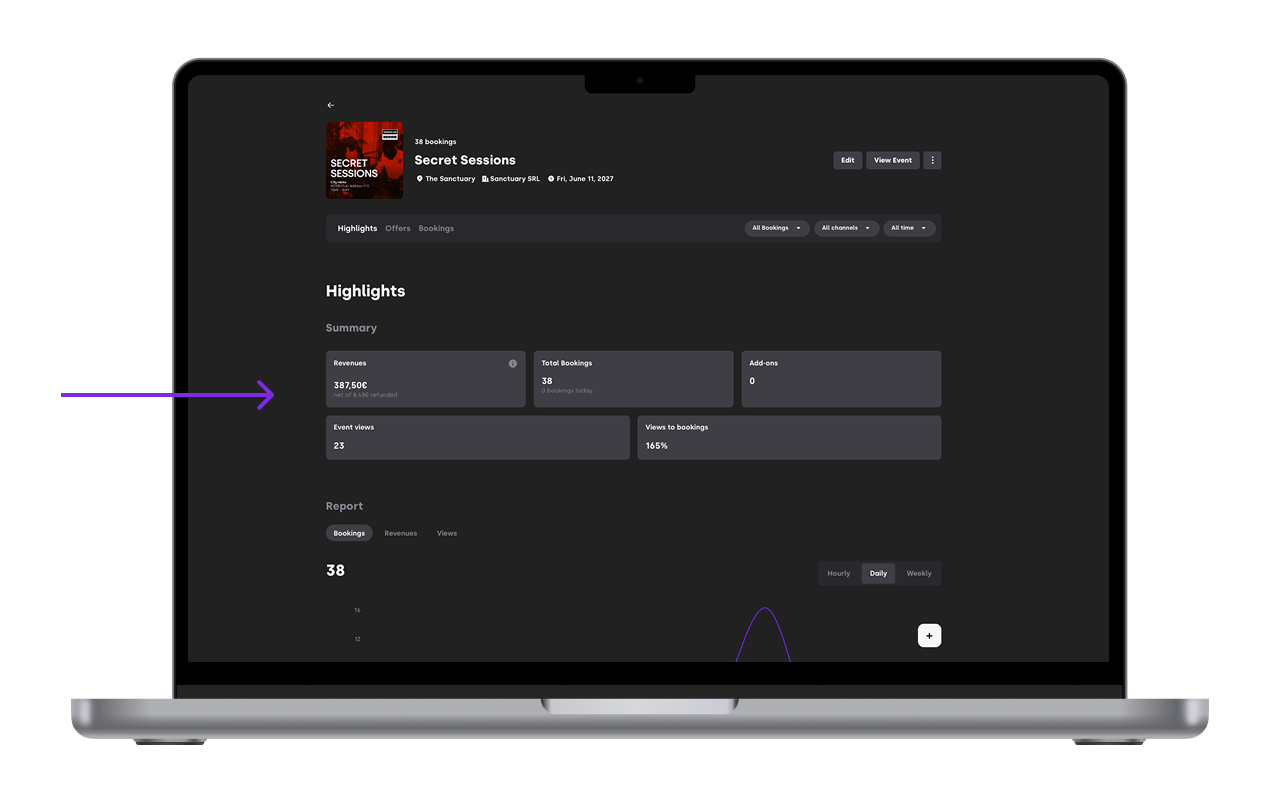
2. Performance: understand your data views
Your report data is shown in tables and graphs that match the filters you selected.
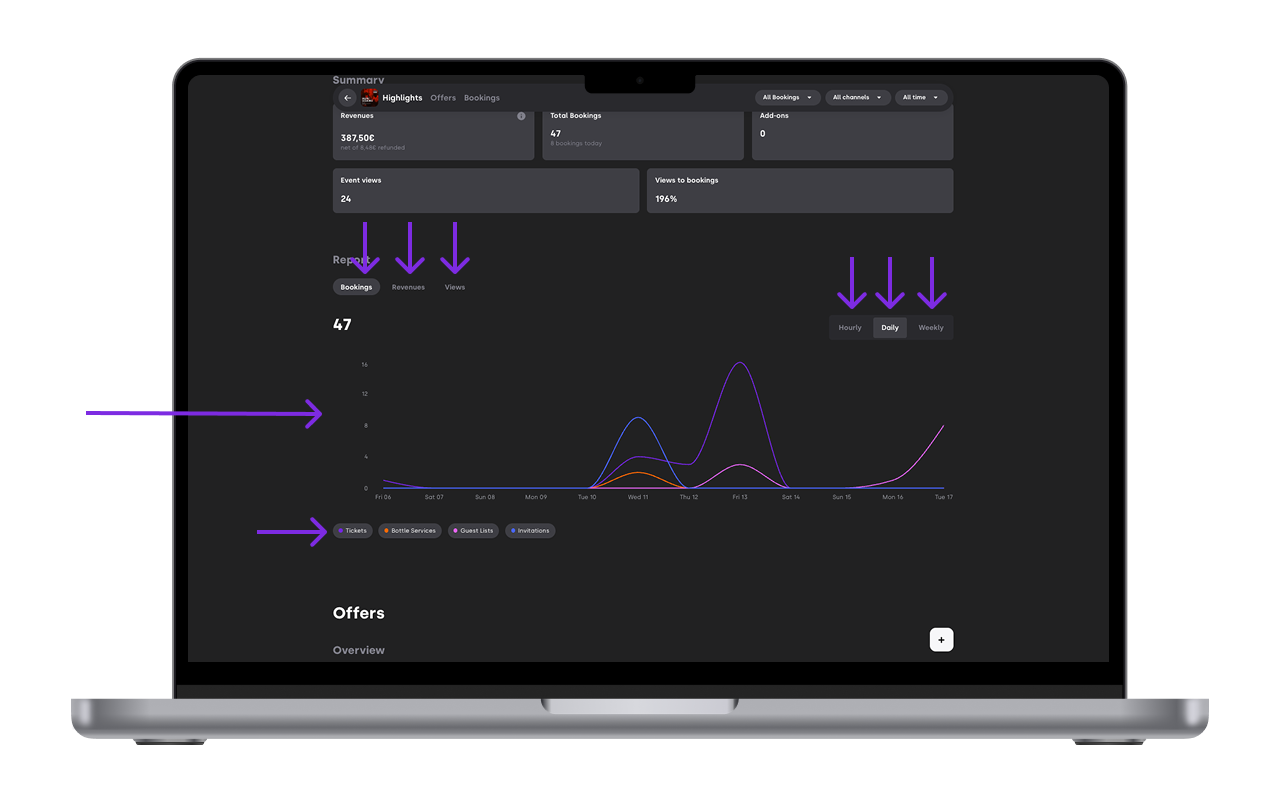
2.1 Line chart: bookings, revenue, or views over time
You can display results on a:
Daily basis
Weekly basis
Monthly basis
Distinguish between the different type of offers

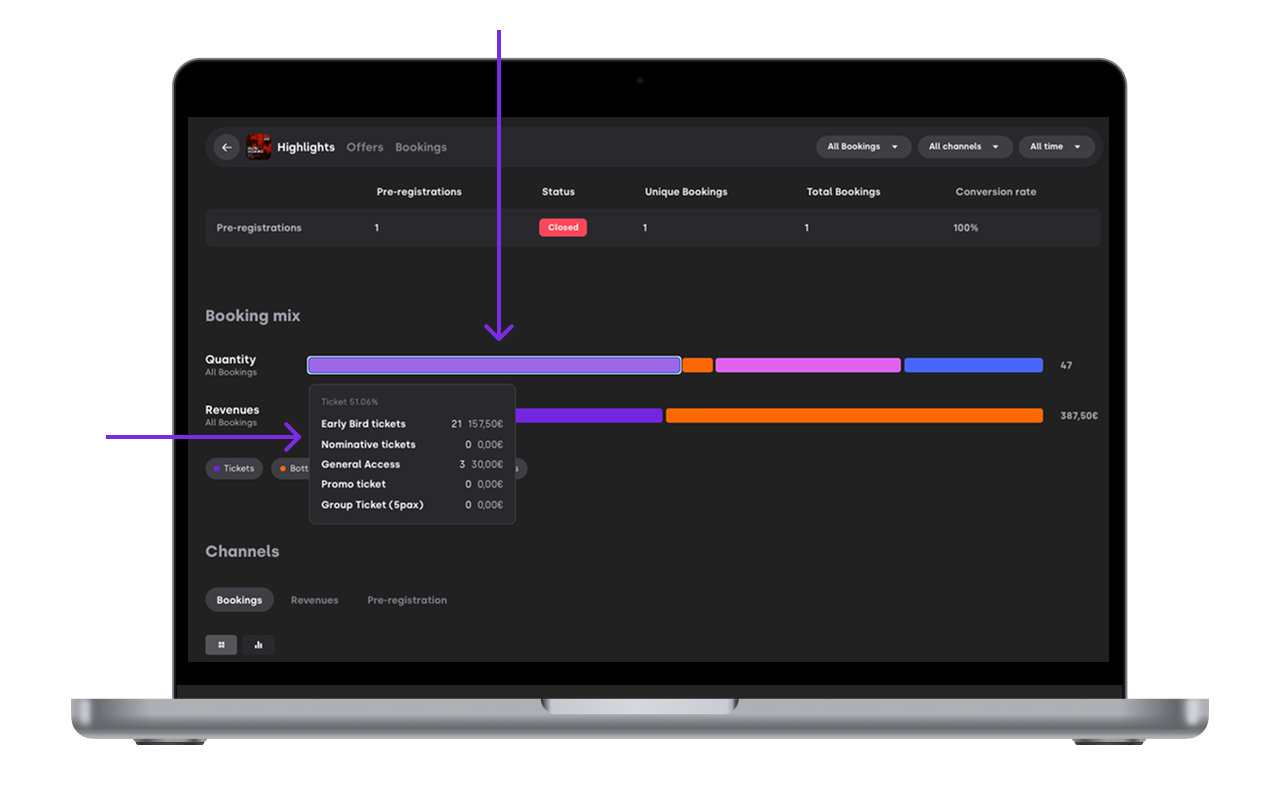
2.2 Booking mix: which offers drive your sales
Use the bar chart to see what offers have the most weight in your sales.
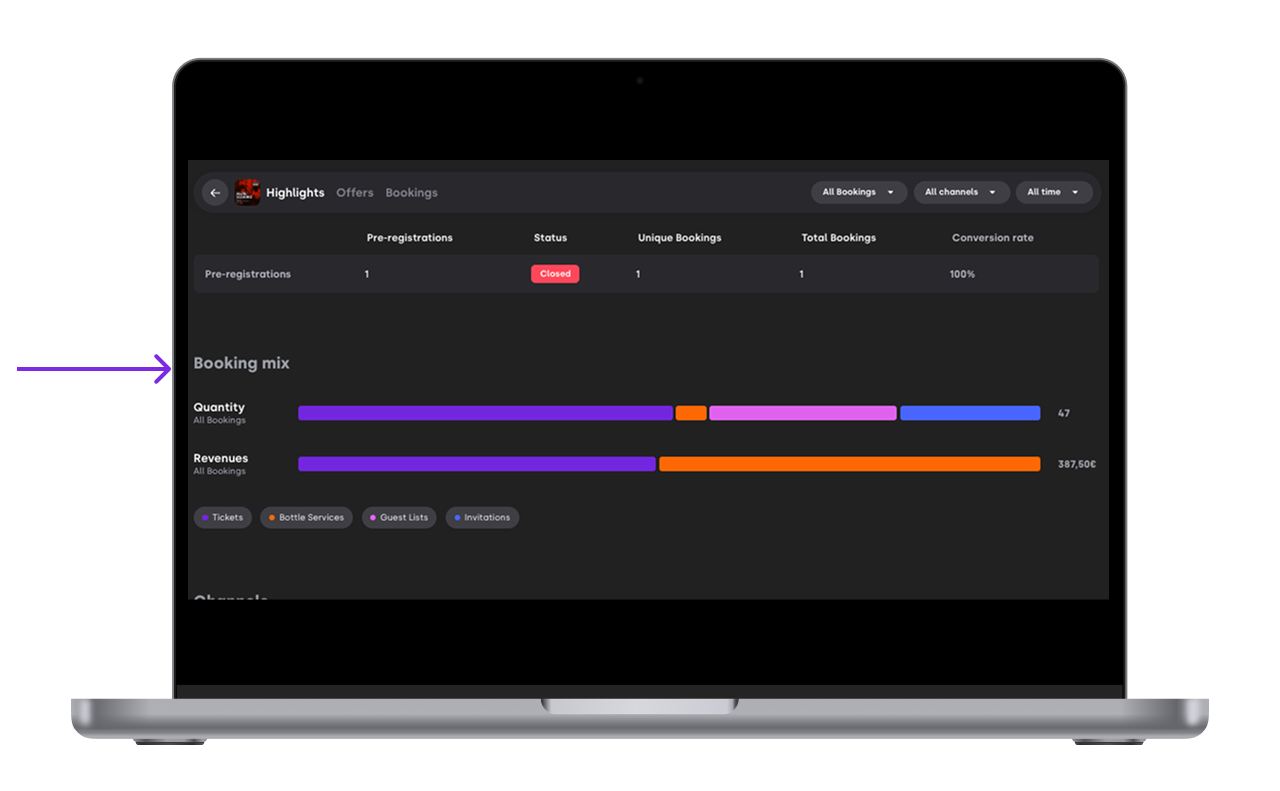
2.2.1 Drill down into a specific offer type
Within each offer type, you can click the bar to see which specific ticket or table types sold the most.
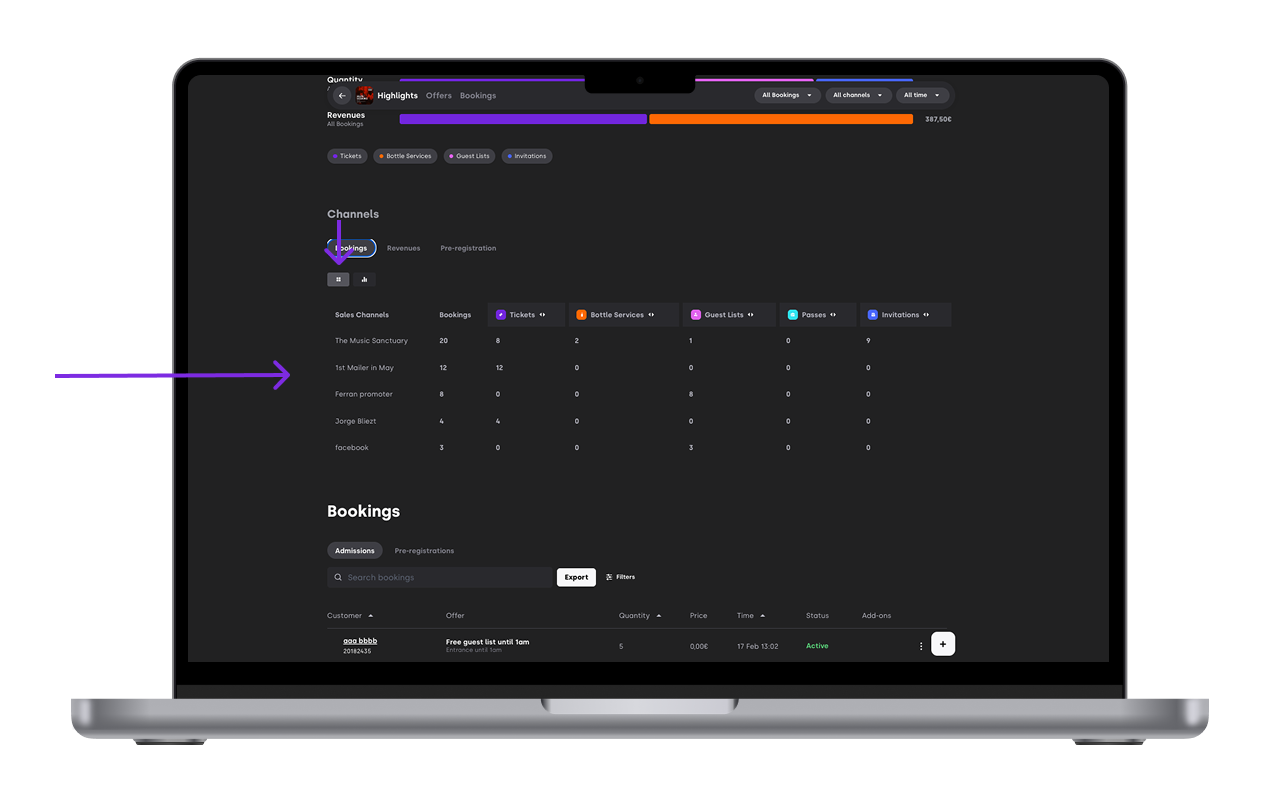
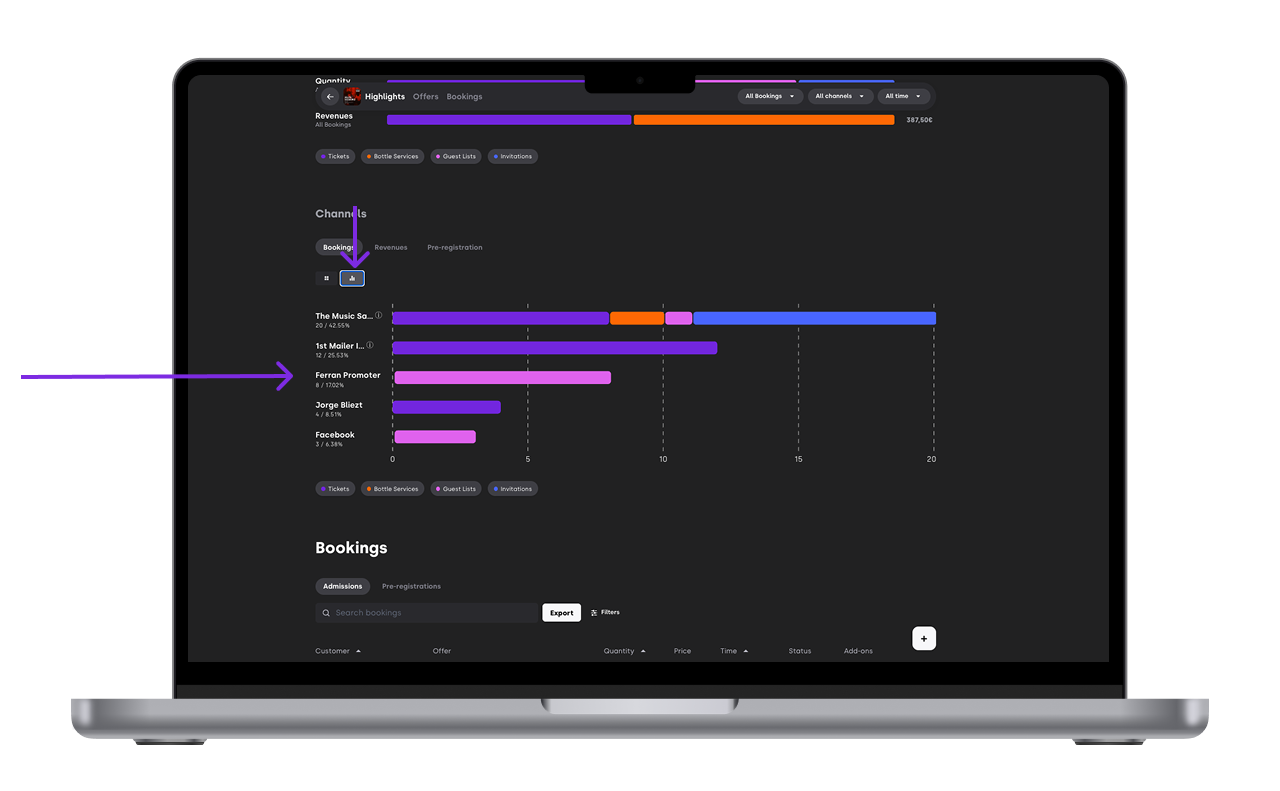
2.3 Channel performance: who’s bringing the crowd
Use the channel list or bar chart to compare promoters/channels and understand who is converting best.
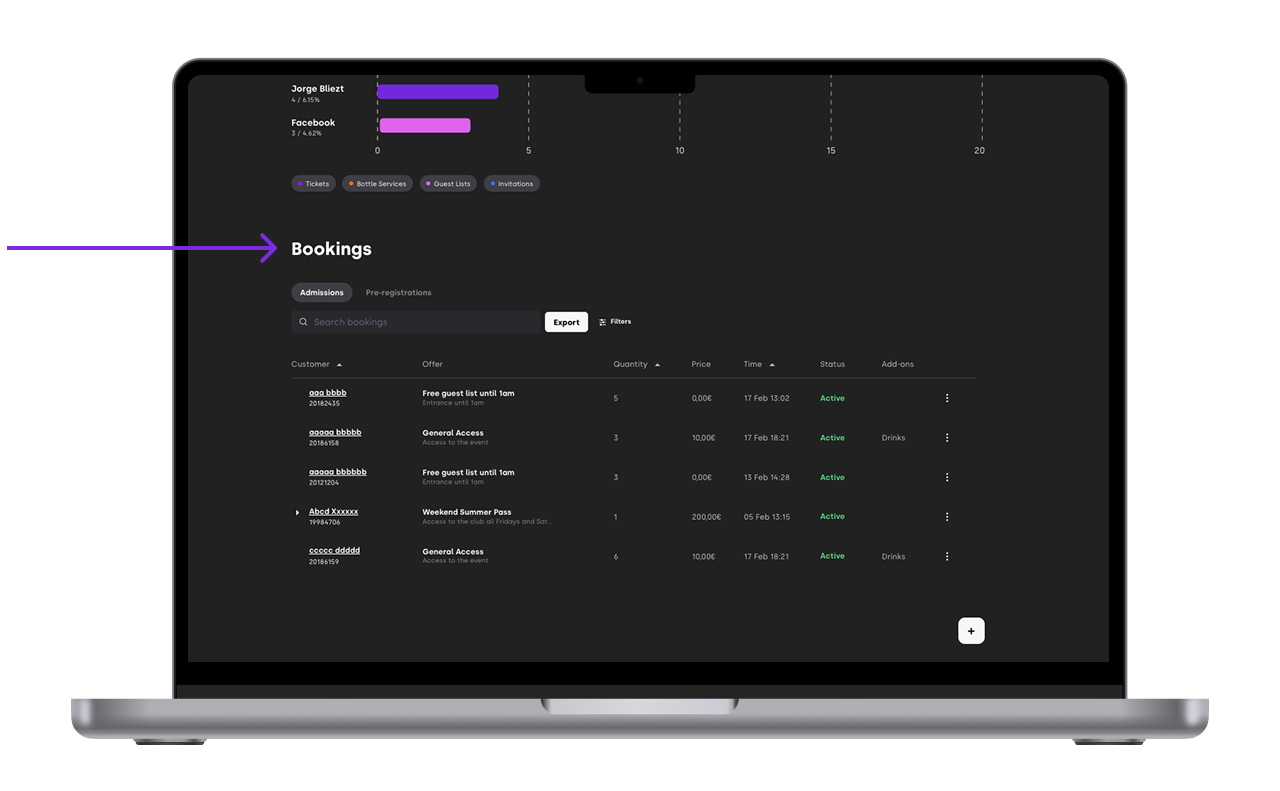
3. Bookings: find customers fast (and filter smarter)
The Bookings section includes client details plus extra filters to help you find exactly what you need.
3.1 What you can see in the bookings list
Name
Booking ID (number under the name)
Offer type (with short description)
Quantity
Price
Booking time
Status

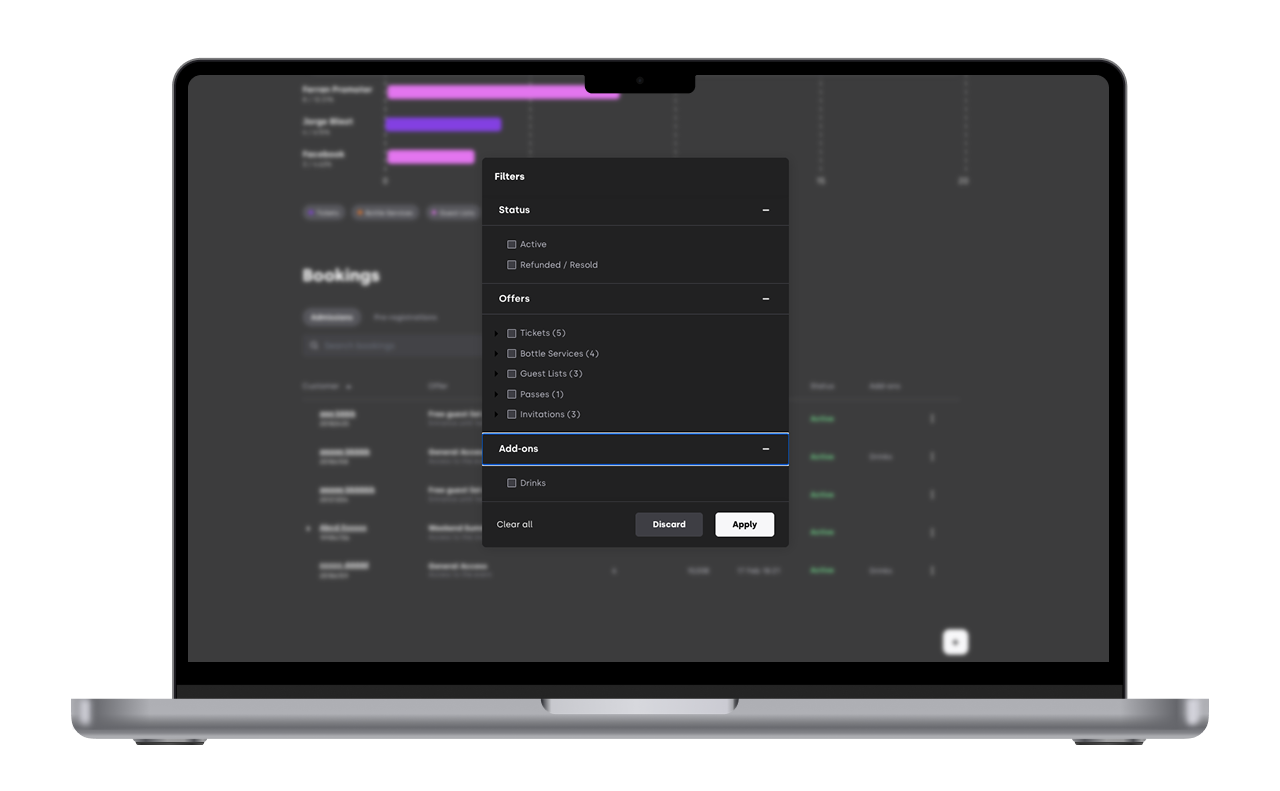
3.2 Filters
Use the status filter to separate:
Active bookings
Refunded bookings
Use the offer filter to se different customer by offer purchased
Use the add-on filter to view bookings that included an add-on.
If you have any other questions check our FAQ page or contact support@xceed.me